Showing posts with label Severe Weather. Show all posts

Monday, April 15, 2013

Severe Weather Poised to Strike Again

Last week's severe weather outbreak was largely a bust despite the system producing nearly 400 damaging wind reports, over 350 severe hail reports, and 40 tornado reports in six days.  Eight of these tornado reports were associated with an EF3 tornado that touched down in eastern Mississippi and traveled just over 68 miles into western Alabama, leaving one dead and nine injured.  However, most weather models overpredicted the amount of moisture that was present in front of this system, which led to a threat in reality that was less concerning than was once predicted.  If a more unstable air mass had been present, this system would have likely produced many more severe weather reports, including more long tracked, violent tornadoes.  The Storm Prediction Center noted this issue when describing their somewhat busted forecasts and stated that this tends to be a concern for the first early severe weather season system.

Well, here we go again, as another system approaches many of the same areas as last week's system.  This time the concern that the models will overpredict the amount of moisture present should be significantly lower.  This is due to the amount of moisture left behind by the last system as well as continued return flow from the Gulf of Mexico across most of the threat regions.  A dry line and stationary front today and tomorrow will remain nearly stationary until Wednesday when it begins to push east, reaching the east coast by Friday.


The largest threat at this point is expected to occur on Wednesday and Wednesday night.  The Storm Prediction Center has issued a Day 3 moderate risk for portions of central Oklahoma, southeast Kansas, and extreme southwest Missouri.  This is only the twelfth time the Storm Prediction Center has issued a Day 3 moderate risk since the first one was issued for a June 10, 2005 event.  Of the 12 events, four events resulted in the issuance of a Day 1 high risk.  These events resulted in varying reports of severe weather but all resulted in some reports.  The June 10, 2005 event recorded the least amount of severe weather but this also comes at a time when severe weather reports were not reported as frequently as today.  In this event, only 4 tornado reports resulted along with 55 wind damage reports and 59 severe hail reports. However, some events that prompted Day 3 moderate risks that were later upgraded to Day 1 high risks resulted in much more historic events, such as April 27, 2011 and April 14, 2012.

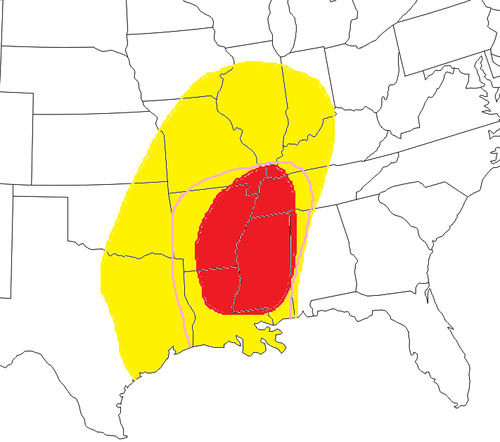
The risk on Wednesday does appear that it could result in all forms of severe weather, including the potential for strong tornadoes.  To the right is my threat outlines for Wednesday and Wednesday night defined by an area that has the potential for CAPE values above 1000 J/kg within the area outlined by the orange line, potential for convective type precipitation within the area outlined by the green line, bulk shear values greater than 40 knots within the area outlined by the brown line, 0-3 km helicity values greater than 300 meters squared per seconds squared within the area outlined by the red line, and 0-3 km EHI values greater than about 3 within the area outlined by the pink line.  All of this information was used for me to come up with my threat area to the right.

This threat area is very similar looking to the current Day 3 threat issued by the Storm Prediction Center, with a slight risk being portrayed in yellow and the moderate risk where tornadoes would be more likely being shown in red.  The Storm Prediction Center also has a threat area on Day 4 and this is shown below.  I have put together a tentative map of my threat area for this day as well, which will be Thursday and Thursday night.  This day should have fewer severe storms than the previous day due to lower CAPE values and weaker shear values.  However, the threat for an intense squall line to develop is one that could bring widespread damaging wind reports.  The threat for tornadoes will exist but Wednesday and Wednesday night should have a better chance of these.


Once again my threat looks similar to the current Day 4 threat where the Storm Prediction Center has outlined the 30% area of severe weather within 25 miles of a point.  I do not think they will introduce another Day 3 moderate risk tomorrow for Thursday and Thursday night, but I think the area I outlined in red will include a 30% probabilistic at this point.  If as the event gets closer the wind damage threat becomes more apparent or a greater threat of tornadoes appears to evolve than a moderate risk will likely be warranted at that time.

Stay tuned for further updates on this weeks developing severe storms situation!

Friday, April 5, 2013

Early April Severe Weather Outbreak

A potentially major outbreak of severe weather could be in store from portions of the Plains into the Deep South early next week.  This probably could have been predicted months ago when I elected to leave Mississippi during severe weather season to present at the Association of American Geographers Annual Meeting in Los Angeles during this same time frame.  Nevertheless, here are some of my early thoughts on the developing situation.

A low pressure system and associated cold front forming in the lee of the Rockies on Sunday will begin to progress eastward Monday.  As this system progresses toward the east it will become the focus for severe weather for at least the early portions of the week.  Major model differences do exist right now with the most notable difference existing between the timing of the system between the GFS and ECMWF models, which are nearly a day apart on the timing of the front now.  The animation to the right shows the GFS model's progression of the 250 mb winds during its past four model runs.  The GFS has moved the trough further east over the past 24 hours and
tilted it more neutrally.  The ECMWF has the trough further to the west with more of a positive tilt in its two past runs, both shown to the right with the 00Z run from last night on top and the 12Z run from this morning on the bottom.  The timing differences here between the two models are rather vast and mean the difference between severe weather on Tuesday or Wednesday for some.  However, the GFS has a bias in pushing these systems through too quickly and thus it is the ECMWF model that should be given more weight.

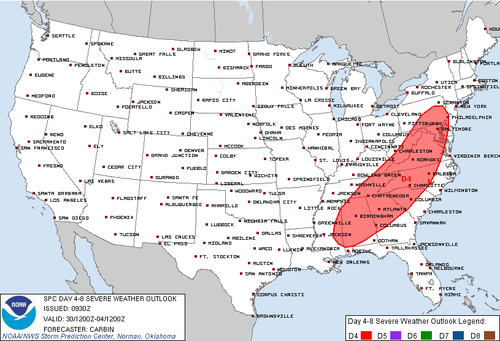
These are the same thoughts the Storm Prediction Center has also abide by in issuing there latest Day 4-8 Convective Outlook, seen below and to the right.  An enhanced severe threat would be possible over a small portion of western Kansas on Monday, to the northeast of the surface low.  A larger threat area would exist on Tuesday over eastern Kansas, eastern Oklahoma, northeast Texas, western Arkansas, and western Missouri.  Wednesday the threat would move into portions of northern Louisiana, western
Mississippi, eastern Arkansas, southwest Missouri, western Tennessee, western Kentucky, and southern Illinois.  The threats over these three days will include all forms of severe weather with some large tornadoes possible, especially on Tuesday and Wednesday.  Unfortunately, until the GFS comes around toward a solution that is similar to that of the ECMWF, most of the products I am able to look at do not depict an event I believe will actually occur.  Therefore, I have created my own map showing where I believe the threats will be on Tuesday and Wednesday based on limited ECMWF guidance.  The orange outlined area is the area I believe could see CAPE values in excess of 1000 J/kg.  Meanwhile the green line represents the area that according to the ECMWF is at risk of precipitation during this time period.  As of right now, without knowing much more than this, the threat area could really be just about anywhere within this region, which I show in red shading.  However based on some other analysis, I have also tried to outline an area of where I think a greater likelihood of severe weather could occur, which I shaded in pink.  This is my preliminary outlook, I will update this sometime this weekend, especially if the GFS and ECMWF begin to converge on a more similar scenario.

Monday, January 28, 2013

Severe Weather Update!

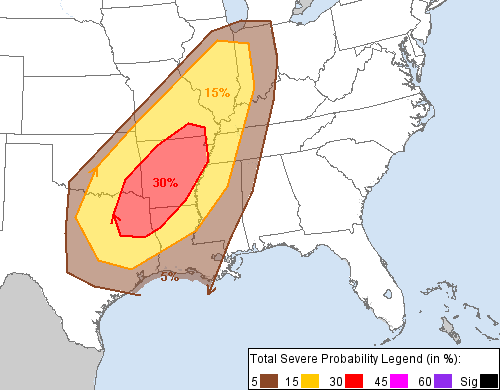
My initial thoughts on the severe weather outbreak that will begin tomorrow have changed only slightly since last night when I first posted them.  For those who may not have seen my post from last night, here is the link to it.  At the time the Storm Prediction Center (SPC) was about to issue its first Day 2 Outlook for this event, which can be seen below.

image

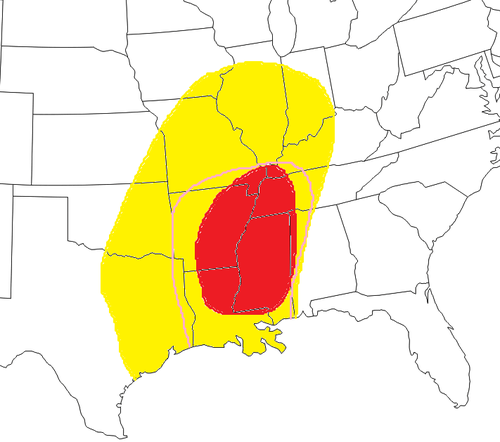
This outlook looked very similar to the previously issued Day 3 Outlook but had some major differences when compared to the map I posted just a hour before they issued their outlook, which can be seen below.

image

While I did not disagree with the location of the 30% risk issued by the SPC, I questioned their reasoning for not continuing this risk into the night, downstream of their current region.  It appeared the only reason may be a concern about decreasing instability overnight but as I viewed the models again, I was confident this should not be a limiting factor.  In fact, as I will show further in this post, the best instability will actually be during the early overnight hours.

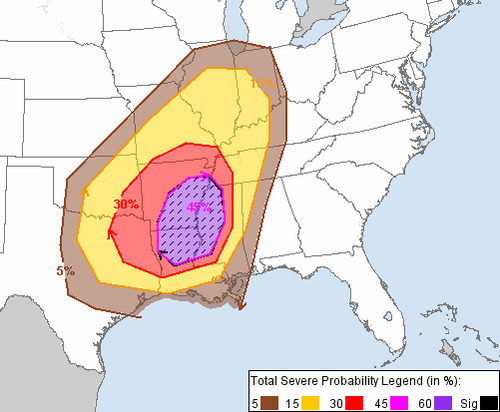
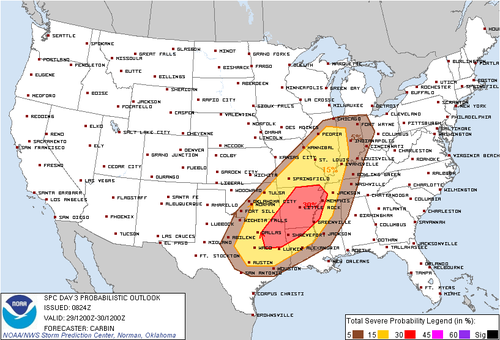
Late this morning during the next issuance of the Day 2 Outlook, the SPC issued an outlook which was much more in line with my previous thoughts from the night before, as can be seen below.  In fact, a moderate risk was even issued for some areas (seen here as the 45% hatched region).  This new outlook actually raised some areas in Mississippi from a 5% risk of severe weather within 25 miles of a point to a 45% chance of severe weather within 25 miles of a point with at least a 10% chance of significant severe weather, a very drastic change!

image

This will be the first significant severe weather outbreak of the year, with tens to hundreds of damaging wind reports expected and perhaps a few tornadoes as well.  Just how significant might this event be?

Well, over the past 15 years, only five Day 2 moderate risks have been issued in January by the SPC.  What happened those other four times?

January 22, 1999: 43 tornadoes, including 2 F3 tornadoes, injured 20 people and killed one across Alabama, Arkansas, Illinois, Kentucky, Louisiana, Mississippi, Tennessee, and Texas resulting in about $76 million in damages.

January 3, 2000: 11 tornadoes, including 3 F3 tornadoes, and 101 wind damage reports resulted in 21 injuries across Arkansas, Indiana, Kentucky, and Mississippi resulting in about $72 million in damages.

January 2, 2006: 18 tornadoes, including 1 EF3 tornado, and 73 wind damage reports as well as 107 reports of 3/4” hail or greater resulted in 5 injuries across Georgia, Florida, Illinois, Kentucky, and Missouri resulting in $7 million in damages.

January 13, 2006: 19 tornadoes and 45 wind damage reports injured 34 people and killed one across Alabama, Florida, Georgia, Louisiana, North Carolina, South Carolina, and Virginia resulting in $7 million in damages.

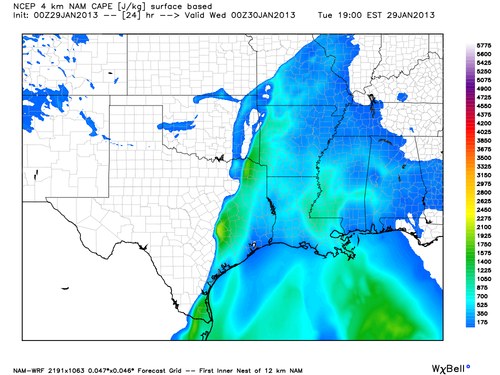
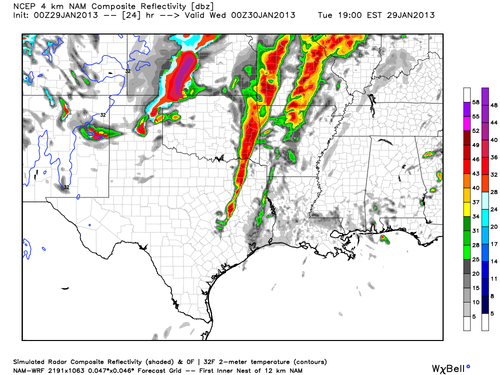
Needless to say, a multi-million dollar day in damages could be ahead of us based on these prior events.  So let’s take a look at the details using the 00Z NAM model run.  I expect that thunderstorms will be ongoing at the start of the day in the Oklahoma area and will quickly expand in coverage throughout the morning across the western portions of the threat region.  It appears initial convection will begin to form into a squall line rather quickly, though a few discrete cells out in front of the line in Arkansas, Missouri, or Illinois may not be out of the question.  By afternoon instability will be on the increase as evidenced by the image below showing CAPE values during the evening.  This will allow the squall line to intensify as it becomes more organized across Texas, Arkansas, Oklahoma, Missouri, and Illinois, as shown by the simulated reflectivity image below for the same time as the CAPE image.

image

image

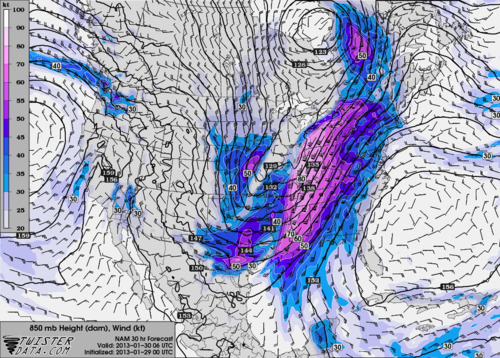
As night falls, expect CAPE values to remain steady or rise slightly in front of the squall line as the trough becomes more negatively tilted.  This will allow colder air to flow in aloft resulting in steeper lapse rates and these better CAPE values.  Additionally the low-level jet will really strengthen after nightfall, aiding in shear values which could improve the chances for tornadoes as well as the chances for wind damage.  This low-level jet is shown for around the midnight hour and it can be seen that many areas will have wind speeds of 50 knots or greater just  a few thousand feet above the surface.

image

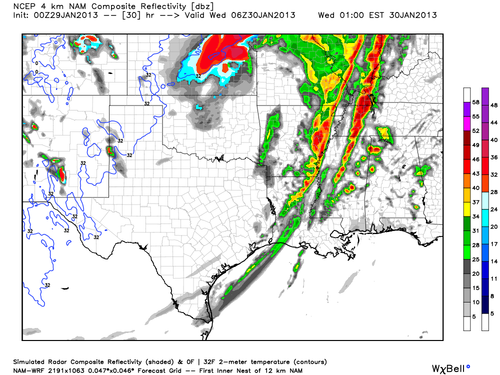
This could strengthen effects of the squall line even further as shown by the simulated radar image below for around midnight.  One other serious thing to note on this radar image is something the NAM model has been advertising more and more today and it will be interesting to see what the RAP and HRRR models have to say about this soon when they begin to predict out this far.  That thing is, discrete cells in front of the squall line.  According to the latest run of the NAM, these cells may start up in southern Mississippi and southern Alabama a couple hours after dark and rapidly speed toward the north northeast at 40 to 60 mph.  Current indications are that these discrete cells could affect portions of Mississippi, Alabama, and Tennessee before being overtaken by the fast-moving squall line in the early morning hours.

image

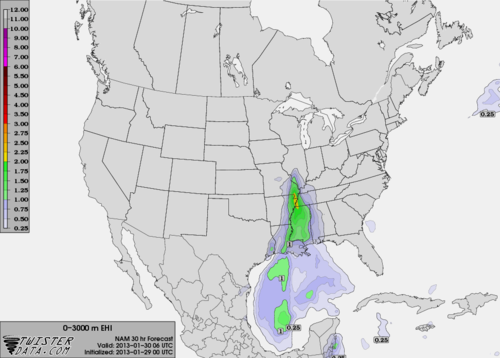
If these cells do indeed form, they will have incredible speed shear to work with and some directional shear.  This shear has resulted in large helicity values across the aforementioned region and EHI values could also be fairly good for this time of year.  The EHI values for around midnight are shown below.  It is important to note that while the RAP model does not show out this far in the future yet, comparing times that it does go out to with the NAM solution has indicated that the RAP believes that EHI values could be stronger than the NAM depicts.  Stronger EHI values could show a greater chance of tornadoes during the overnight hours.

image

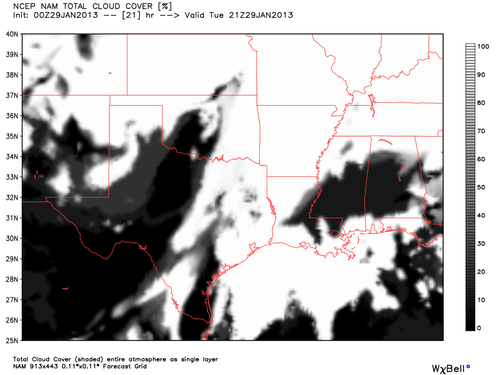
Another thing that could aid in the evolution of supercells during the night is what the NAM model indicated could occur during the afternoon hours across portions of Mississippi and Alabama.  This thing is a clearing in the clouds.  If the clouds do clear for a bit or even thin during the afternoon hours, daytime temperatures could raise quickly resulting in higher values of CAPE and a much more unstable atmosphere.

image

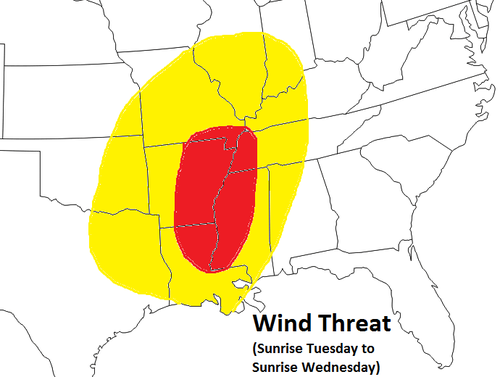
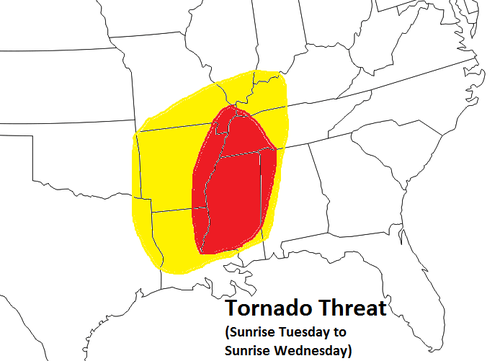
After the early morning hours, discrete cells should begin to die off and merge with the squall line as instability wanes.  The squall line should also weaken some as we head into sunrise.  Given all of this information I have produced a couple more maps below indicating my threat regions for wind damage and potential for tornadoes.

image

image


Tomorrow and tomorrow night will certainly bring about many wind damage reports.  Tornadoes will certainly be a possibility, especially if those discrete cells form overnight.  Nevertheless, any sunshine that can peak through tomorrow will enhance the severe weather threat but even without the sun, a potent trough coupled with strong atmospheric winds at all levels will be enough to spark severe thunderstorms.  Keep alert and know where you can get your severe weather information tomorrow and especially tomorrow night.  Try to find a way to get notifications even when you are asleep as these will be the best hours for tornado potential.  Stay safe everyone!

Thoughts on the January 29/30 Severe Weather Outbreak

A strong cold front will push its way across the nation over the next few days, sparking severe weather for many areas.  The Storm Prediction Center has issued areas of concern for both Tuesday, January 29th as well as Wednesday, January 30th, which are presented below.  Based on what I have been looking at, I will give my best insight into where I believe the threat will be during the hours of January 29th into the morning of the 30th.


The 00Z NAM model is in fairly good agreement now with the past few runs of this model and the 00Z GFS model has begun to come around to a more similar solution to what the NAM has been advertising over the past day.  Therefore, I will only show the 00Z NAM model figures below, keeping in mind that the 00Z GFS model is similar but running a few hours faster than the 00Z NAM model.

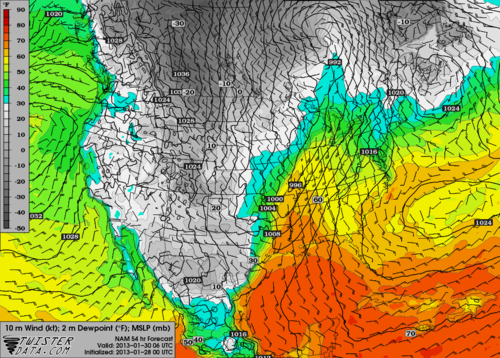
The first image below is dewpoints from 06Z Wednesday, as this is when they will be maxed out for most areas that have not had the front pass them yet.  Dewpoints in the mid to upper 60s will exist across most of Louisiana and Mississippi during this time frame with 60 degree dewpoints extending as far north as Illinois.  It is also important to note the strong southerly flow in the warm sector.


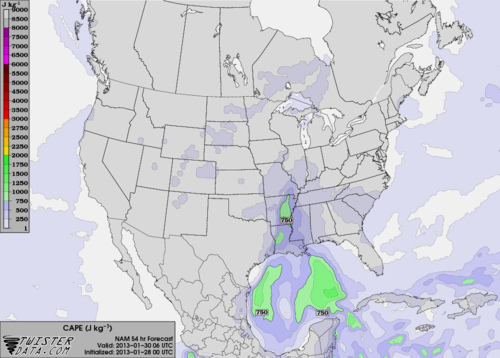
CAPE values will be limited across the severe weather region but a large swath of 500 J/kg or more should exist throughout the day and overnight along the lead edge of the front.  While this is not a large amount of CAPE by any means, there will be enough forcing from other means to trigger storms.  The biggest factor that the limited CAPE could play into is limiting the threat for supercells in front of the main squall line.  However, as can be seen in the image below, which is once again for 06Z Wednesday, CAPE values may surpass 750 J/kg and near 1000 J/kg during the overnight hours, which is not bad considering that it is night and that values struggled to reach this during the day.


Couple these CAPE values with an intense low level jet, which will strengthen overnight, and the threat for tornadoes will certainly exist across portions of Arkansas, Louisiana, Mississippi, and Tennessee.  The tornado threat should also be greater at night as the trough begins to rotate from a positive tilt into a more neutral to negative tilt by morning, helping to aid in more cold air aloft, which is likely helping to raise the CAPE values too.

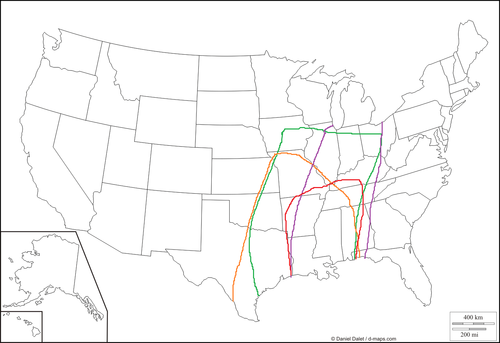
In my forecast I have taken into account where dewpoints of at least 55 will exist, taking into account where precipitation will be occurring during the time frame as well.  This I have outlined in the green color.  Next in orange I outlined an area which should see CAPE values in excess of 500 J/kg.  Next I looked at where low-level winds will be strongest by viewing surface winds up to 850 mb and I outlined this area in purple.  I viewed EHI values as well as helicity values to determine where these values were the best and outlined that area in red.


This information, coupled with my general meteorology knowledge and having started following this system since it was over 300 hours away, I have come up with the following map depicting the areas most at risk for damaging thunderstorms during what the SPC will consider the Day 2 time period when they issue their new outlook in less than one hour.  The yellow area represents an area where I would expect to see isolated to scattered wind damage and the red area represents an area where I would expect to see more scattered to widespread wind damage reports.  The red area receives this heightened threat due to the fact that lower level winds will be stronger at night and this is when the storms will impact this area.  Additionally, this area is also at risk for a few tornadoes as I outlined my best tornado threat area in pink.


Overall I would expect this to be mainly a damaging wind event given how strong the low-level winds are and that the main storm type should be linear.  However, even with the limited CAPE values, especially in the nighttime hours I would not rule out a few tornadoes.  The threat of tornadoes could be higher if supercells can form out in front of the main line of storms but this will likely not be known for sure until the event draws closer.  Definitely stay tuned to wherever you get your weather information and be on the lookout for another blog from me tomorrow night to update my forecast.

Tuesday, August 7, 2012

Another Late-Week Severe Weather Threat

Originally posted on ZoomRadar

As the end to another week approaches, so will the threat for severe weather. Another advancing cold front late this week will bring a slight risk of severe weather from portions of Missouri and Illinois east to New York and parts of New England on Thursday and Thursday night before affecting areas from the Carolinas north to the New York City area on Friday and Friday night. Below is the predicted surface maps from the Hydrometeorological Prediction Center starting on Thursday morning and continuing into Friday morning and Saturday morning.

The threat of severe weather has prompted the Storm Prediction Center to issue a slight risk for both Thursday and Friday which can be seen below.
Besides the infiltration of colder air behind the cold front, many factors will help lead to this severe threat. Taking a look at the latest 12Z NAM model run to view these, the first thing to notice is the upper air support that will be in place as the jet stream sinks into the United States from Canada. Below is what that may look like come Thursday evening and Friday evening.
As this trough digs and becomes more neutral, the storms will likely increase in intensity for Friday. While winds in the jet stream will only be about 50 knots above the Mid-Atlantic come Friday evening, this will still be more upper air support than this area has seen in awhile and therefore will help any thunderstorms that form that day.
The next thing to consider is the moist and unstable air mass that this front will be pushing into. Below are the images showing the dewpoint temperatures and CAPE values on Thursday evening and then below that on Friday evening.
What is being depicted here is a drastic change in the amount of moisture in the air before the front and behind the front. In front of this cold front, we may expect to see dewpoint temperatures on both Thursday and Friday in the 60s and perhaps lower 70s in a few places. CAPE values will likely remain between 1000 and 2000 J/kg for most but a few areas could see values reach at or above 3000 J/kg. Behind the front, CAPE values fall drastically to values closer to 0 as expected with a sharp cold front but more dramatically, dewpoint temperatures will fall to below 60 and in some cases to near 40! This drastic change will result in numerous thunderstorms initiating on both days as shown by the composite reflectivity from Thursday evening and Friday evening below.
Due to the fairly low shear environment across much of the threat area on most days, the threat of tornadoes should remain pretty low. However, a tornado or two cannot be ruled out, especially on Thursday across the Midwest. That being said, the main threat should be damaging winds with some large hail possible. Keep an eye on this developing situation as we head into the late work week.

Friday, August 3, 2012

Update to Weekend Severe Weather

Originally posted on ZoomRadar

As mentioned in my previous blog post, a strong cold front has been predicted to trigger strong to severe thunderstorms as it tracks to the east from the Plains to the Atlantic Coast this weekend. For this reason, the Storm Prediction Center has issued a slight risk for areas in front of this cold front today straight through Sunday. Below are the outlooks issued by the SPC.


Day 1 Outlook - Wind (Today and Tonight)

Day 1 Outlook - Hail (Today and Tonight)

Day 1 Outlook - Tornado (Today and Tonight)

Day 2 Outlook (Saturday and Saturday Night)

Day 3 Outlook (Sunday and Sunday Night)
Now let’s take a look at the specific details of why this threat exists starting with today. Below are images from today’s 12Z NAM model run showing what the scenario may look like come this evening.

Precipitation

Dewpoint Temperatures and Surface Winds

850 mb (Low-Level Jet) Winds

250 mb (Jet Stream) Winds

500 mb Relative Vorticity

CAPE

EHI
Today and tonight thunderstorms are expected to break out in a fairly unstable environment across mainly Nebraska, South Dakota, North Dakota, and Minnesota. Dewpoint temperatures will be generally greater than 55 but as high as the low 70s in some areas which will really aid in creating a moist and unstable environment. 850 mb winds will generally be pretty weak but the storms will get some help from faster winds in the jet stream reaching up to 90 knots in some spots. The trough associated with the surface cold front will still be positively tilted and positive vorticity advection will be somewhat on the low end. Taking a look at CAPE values, some areas may see values reaching above and perhaps beyond 4000 J/kg but most areas will remain between 1000 and 3000 J/kg. The last image shows us that EHI values may become pretty high with values above 6 in some areas. If this turns out to be the case we may see a small tornado threat this afternoon and evening. In fact, today may pose the best chance for tornadoes as this trough pushes across the northern portions of the country. Overall, most storms will pose a damaging wind and perhaps some large hail threat. Today will likely pose the least risk of severe weather this weekend. That being said though, there will definitely still be severe weather today and tonight across the Northen Plains, as depicted by the SPC’s outlook percentages.
Below are images from today’s 12Z NAM model depicting what conditions could be like come Saturday evening.

Precipitation

Dewpoint Temperatures and Surface Winds

850 mb (Low-Level Jet) Winds

250 mb (Jet Stream) Winds

500 mb Relative Vorticity

CAPE

EHI
Saturday I expect the severe weather to start firing up even more. The reasons behind this can be seen in the graphics above. First off, dewpoint temperatures will top out generally higher than the day before with values at and above 65 and perhaps as high as the upper 70s. Surface winds will be about the same magnitude out of the south but winds at the low-level jet level will be stronger with some areas potentially seeing these winds hit 40 knots. Winds in the jet stream will also be stronger, peaking above 100 knots across northwest Wisconsin on Saturday evening. The jet stream will also be aligned in a way now that the right rear quadrant should provide some extra lift for thunderstorms to form and become stronger. The trough will also slowly start becoming more neutral in nature and positive vorticity advection will become stronger, especially across the more northern portion of the nation. We also see that CAPE values will be generally the same as the day before with some areas topping out at and above 4000 J/kg. The last measure, EHI, will once again present some fairly high values mainly across Illinois and Indiana so we may see a slight tornado threat across this area as well as somewhat but to a lesser extent to the north of these regions. Once again, the main threat on Saturday and Saturday night will be damaging winds and some large hail.
Below are images from today’s 12Z NAM model depicting what conditions could be like come Sunday evening.

Precipitation

Dewpoint Temperatures and Surface Winds

850 mb (Low-Level Jet) Winds

250 mb (Jet Stream) Winds

500 mb Relative Vorticity

CAPE

EHI
Sunday and Sunday night will likely present the largest threat for severe weather out of the three days. Once again we will see high dewpoint temperatures from the mid 60s to as high as the mid 70s with nice southerly surface winds, helping to increase the moisture content of the air even more. Winds at 850 mb will be the strongest out of any of the three days with some areas just north of New York in Canada, seeing these winds peak at above 60 knots. The jet stream winds will once again be strong, topping out at above 100 knots, and placing that right rear quadrant right across a portion of the threat region. Our trough by now will likely have tilted negative which will help enhance that threat of severe weather as it makes this tilt towards negative on Sunday. 500 mb positive vorticity advection will likely remain fairly strong, especially across the northern portions of the threat area. CAPE values may be lower on Sunday but it is the current thought that the strengthening of upper air processes will outweigh this. Still, CAPE values will generally be above 1000 J/kg which will be enough instability for these storms to maintain themselves. EHI values will generally remain below 2 with some pockets being a little higher so the tornado threat should be pretty low. However, this does not mean that an isolated tornado risk cannot be ruled out. Once again though, the main threats will be damaging winds and some large hail.
This weekend will surely lead to multiple severe weather reports, including some large hail, perhaps a couple tornadoes, and what will likely be some widespread damaging wind reports. Please remain aware this weekend across the northern portions of the Plains, Midwest and Northeast.