Showing posts with label Seasonal Outlook. Show all posts

Monday, April 1, 2013

Spring and Severe Weather Season are Here

After a very warm start to spring last year, this year's below average temperatures that plagued much of the nation have left many wondering whether spring will ever arrive.  To the right is an image from NOAA depicting the temperature anomalies across the northern hemisphere during March.  Many parts of the eastern two-thirds of the nation saw temperature anomalies anywhere from one to as much as five degrees Celsius below average.  However, areas in the southwestern United States actually experienced above normal temperatures.

The reason for this can be seen in the two images at left, with the top image showing the Arctic Oscillation (AO) and the bottom image the North Atlantic Oscillation (NAO).  During much of the month of March the AO was negative.  It even reached record negative levels during the later part of the month.  When the AO is negative, the frigid air that is normally confined to the polar regions is blocked and forced to sink into the mid-latitudes.  During this time, if the NAO is also negative then the cold air tends to flow into the eastern half of the United States.  This was also the case for much of the month, especially the mid to late portion.

The red lines in the figures above depict the model forecast for these indexes over the next half month.  As can be seen, after one last cold shot of air this week, the AO is forecasted to spike well into the positive numbers.  During this same time, the NAO is forecasted to continue to trend towards neutral to perhaps even slightly positive.  This is a signal that spring is here!  The latest temperature outlook from NOAA also depicts this, forecasting above normal temperatures across most of the country for the month of April, as seen in the image on the right.  Now that spring has arrived however, severe weather will begin to get rolling with it.  The slow start to severe weather season this year was due entirely to the slow onset of spring and now that spring is here, severe weather will arrive with it.

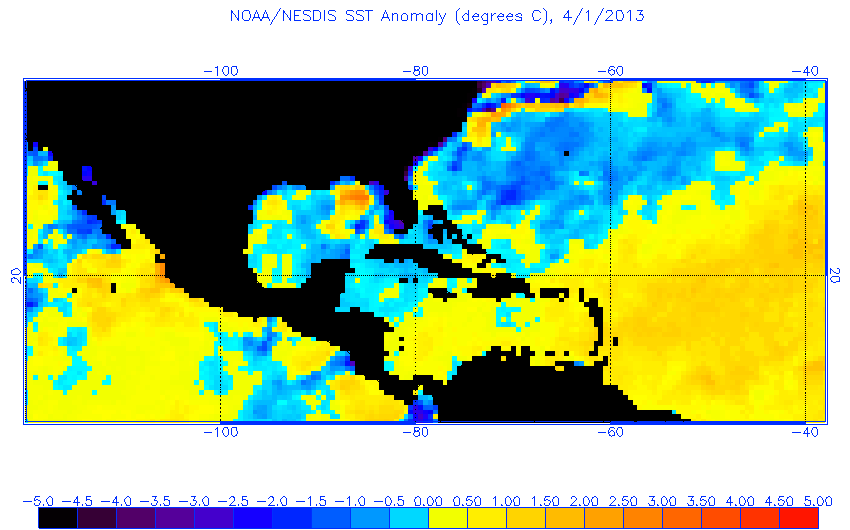
http://www.ospo.noaa.gov/data/sst/anomaly/2013/anoma.4.1.2013.gifOver the past four days, there has already been 242 severe hail reports, 119 reports of damaging wind, and 6 tornado reports.  While the preliminary count of tornado reports thus far this year remains very low, it is important to remember that this year really is not that far from average in terms of tornado reports up until this point.  In fact, 2011 had only 15 more tornado reports to date.  Last year the severe weather season got off to a very quick start due to the early spring.  However, the early spring led to an early summer and thus an early end to the severe weather season.  This year our spring has started much later but the risk of the onset of summer leading to an early end of severe weather season exists yet again.  This is because if the AO and NAO go positive and stay positive, cold air will be cut off from the United States.  Additionally, a neutral SOI tends to be correlated with lesser amounts of severe weather across much of the nation.  Lastly, if we take a look at the current sea surface temperature anomalies on the left, we see that sea surface temperatures are below average for most of the Gulf of Mexico and Atlantic seaboard.  Taking all of this into account, while there will definitely be severe weather this spring, especially during the month of April, I do not expect this to be an above normal year for severe weather.  However, it probably will not end up being as quiet as last year was overall.  Therefore, the next couple months will likely become active.

That being said, it appears that a severe weather outbreak will be possible next week though the exact placement of the event is still unknown.  Warm air and moisture from the Gulf will begin to surge northward starting later this week and this will ripen the atmosphere for severe weather.  Areas that should keep a close eye on this involving situation range from the southern and central Plains to the Southeast and Midwest.

Monday, June 4, 2012

Heat Set to Return to the Northeast and Dry Air Takes Hold in the Southwest

Originally posted on ZoomRadar

Below are the forecasts from the Climate Prediction Center for 6 to 10 days out, June 10th – 14th, for the probability of temperatures being above and below average and precipitation being above and below average.

The Climate Prediction Center has also issued a forecast for the same variables for the 8 to 14 day period which would be from June 12th – 18th.


The Northeast

A cold front pushed through the northeast late last week bringing rounds of storms to the area. Behind that, the northeast has been under an air mass providing for seasonable, if not below average, temperatures for the past few days. Temperatures will slowly begin to climb this week and by this weekend above average temperatures will be in store for most again. The Climate Prediction Center forecasts above average temperatures being likely across the northeast from June 10th through the 18th. The 18Z run of the GFS model depicts this early on in the period as shown below.

The top image shows temperatures for the early to mid afternoon on June 11th and the second image shows temperatures for the early to mid afternoon on June 12th. Temperatures may exceed 90 degrees in some areas meaning daytime highs could reach around the 95 mark in some isolated areas. Most areas of the Northeast will see high temperatures at least into the upper 70s to low 80s with most areas being well into the 80s though.
The forecasts diverge somewhat come the second half of the period as the Climate Prediction Center continues to indicate above average temperatures being likely. However, these forecasts are not as likely as they forecasted during the first half of the period. Meanwhile, the 18Z run of the GFS model expects some cooler air to potentially enter parts of the Northeast. Below is the early to mid afternoon temperatures for June 18th. Some temperatures are struggling to reach the 60 degree mark in New York state on this date according to the GFS. Granted this forecast is pretty far out but it may be that the warm temperature returning to the Northeast this week do not last as long as the Climate Prediction Center believes they will.
The Southwest
The Southwest has been suffering from drought conditions for some time now. As of the May 29th update, most of the Southwest has been classified under a severe drought.
In fact, many of these areas across the Southwest have received little, if any, precipitation during the past two weeks.
This, combined with the lack of precipitation expected in the near future, will set the stage for fire weather across this area. The June 10th through 18th period is expected to result in below average precipitation across the Southwest according to the Climate Prediction Center. The 18Z run of the GFS model shown below shows this below average precipitation over this time period.
For this reason, some areas of the Southwest have been highlighted by the Storm Prediction Center as being under a threat for wildfires on June 8th and 9th. This threat for wildfires will undoubtedly continue beyond this time frame as dry air continues to stay in place.
Below is the 18Z GFS model showing very low dewpoints and strong surface winds across the threat area on the 8th and the 9th. In fact some dewpoints may struggle to hit zero degrees showing just how dry the air will be across the desert Southwest.

Saturday, May 5, 2012

La Nina is Over, What's Next?

Originally posted on ZoomRadar

The current La Nina pattern, which consisted of two distinct periods of La Nina conditions, is officially over after affecting the world for nearly two years. The first period of La Nina conditions began in the summer of 2010, peaking in the late fall and early winter of that year, and finally weakening back to more neutral conditions by the late spring of 2011. This was followed by a brief period of more neutral conditions before La Nina took control once again in the fall of 2011, peaking in the early winter of last year. Well, this has finally all come to an end as conditions have returned once again to being more neutral. What should we expect next, will La Nina be back or will neutral conditions or even El Nino conditions begin?

Below is an image showing the consensus probabilistic ENSO forecast from NOAA. It shows that in the near term, neutral conditions are the most likely. In fact, there is a greater than 50% chance that we will see neutral conditions through about the August time period. After this, at this time it appears neutral conditions are still favored until December when El Nino becomes the most probable. Also it should be noted that El Nino conditions become more likely as the year goes on. What this all means is that throughout the rest of this year, it is likely we will transition from neutral conditions to more El Nino like conditions.

Below are some of the specific models and their predictions. In order to be considered La Nina conditions, a reading must be 0.5 degrees Celsius below normal, and in order to be considered El Nino conditions, a reading must be 0.5 degrees Celsius above normal. In order to be considered an El Nino or La Nina event however, these conditions must persist for at least 5 months in a row.


As you can see, some models predict a transition to an El Nino event beginning as early as June or July of this year. Other models predict El Nino conditions also, but not until the fall. Additionally, some models do not predict El Nino conditions to occur at all. It should be noted however, that almost no models are hinting at a return to La Nina conditions anytime soon.

So what might this mean for our future weather?

With conditions set to transition from neutral to perhaps an El Nino event by the end of the year, weather patterns could do a few things across the United States. One of the biggest things to consider are the effects on hurricanes. Typically there are more Atlantic hurricanes in La Nina years than in El Nino years. Taking this into consideration, there may be less Atlantic hurricanes this year than normal. However, if neutral conditions stick around hurricanes may not be affected at all by this. The reason hurricanes tend to occur less in El Nino years is because there tends to be too much wind shear for them to form. This leads to a lesser number of hurricanes forming way out to sea and actually being able to travel all the way to the United States coast without decaying. It should be noted that tropical cyclones that from closer to the United States do occur in El Nino years just like in La Nina years but due to their close proximity to land already, they often do not become very strong, though this is not always the case.

As far as severe weather goes, due to La Nina conditions and a mild winter, the severe weather season is progressing faster than normal. That being said, neutral conditions could slow this progression but by the time any El Nino conditions would form, the major severe weather season will be over. El Nino tends to push the jet stream further south than normal though which means if it does develop, the fall severe weather season may see more cold shots of air which could lead to more storms than usual.

If an El Nino event does occur later this year, below is the image which depicts how weather patterns typically change in the United States. In general conditions are warmer across the northern United States except in the Northeast. Also most of the southern United States tends to be cooler and wetter due to the jet stream being further south than normal.


It is important to note that the conditions surrounding La Nina and El Nino are only one of many forecasting techniques used to help predict long range forecasts. Therefore, not every La Nina or El Nino event ends up being the same and as some have pointed out, it only takes one extreme weather event to define a season such as a major hurricane striking the United States. So remember to take long range predictions with a grain of salt and to always remain weather aware.

Monday, March 19, 2012

Out Like a Lamb?

Originally posted on ZoomRadar

You know the old saying about March, in like a lion and out like a lamb? Well, March surely started off with a bang considering the month has already tallied over 150 preliminary tornado reports claiming 39 lives. Additionally, over 2,000 high temperature records have either been broken or tied thus far this month and heavy rains have plagued areas of the nation including parts of the ArkLaTex which will see more rain in the next couple days. It has certainly been an active start to the month for extreme weather, but will it continue?

Currently a large trough is pushing its way across the Plains where severe weather will begin to pick up this afternoon into the overnight. This will surely add to the tornado totals as a large area from Texas northward to almost the Canadian border could see tornadoes, large hail, and damaging winds today. The threat will push off to the east tomorrow, though it is expected to be less intense than today.

Following the exit of this system though, what does the rest of March have in store? Taking a look at the 8 to 14 day temperature outlook from NCEP, temperatures will be well above normal for most of the lower 48 to end the month. The only areas of exception are Alaska, which continues to be colder than normal this winter, and the west coast.
The reasoning behind these much above normal temperatures across a majority of the nation is constant ridges which will be in place over the center part of the nation. This will allow for warm air to infiltrate these areas. The 8 to 14 day 500 mb heights and associated anomalies are shown below.
With all of this warm air in place to end the month there are sure to be more high temperature records that will fall but, this also implies that severe weather may be kept to a minimum. Troughs are typically associated with severe weather and with ridges occurring across the center of the nation, severe weather will not find many places to form across the nation. This means that after this current storm system moves through, the rest of March may in fact exit like a lamb.
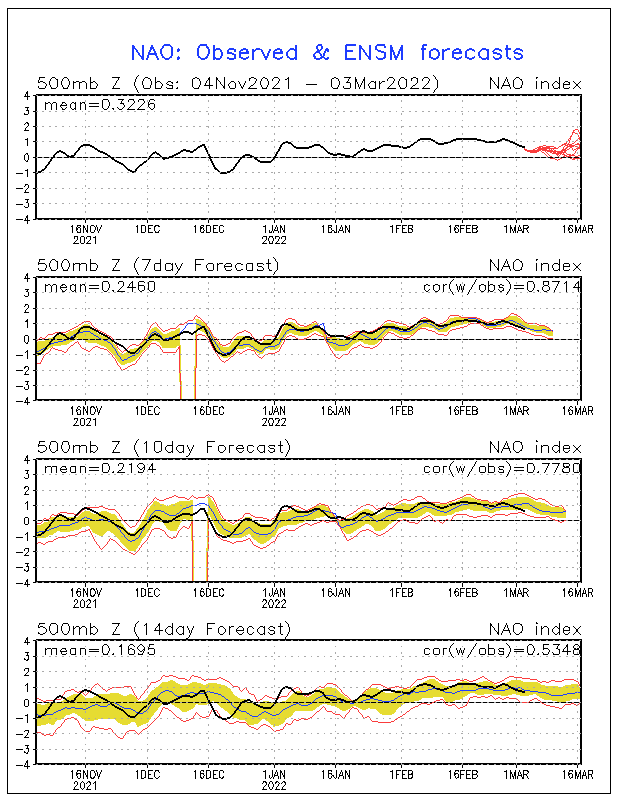
However with all of this warm air in place, if a shot of cold air could be pushed into the United States, severe weather would result. Currently the NAO is positive, as it has been for much of the winter, which has caused the jet stream over the United States to be much farther north than normal. This has trapped most of the truly cold air north of the United States. Models are beginning to show signs that this trend could be coming to an end, at least temporarily. Pictured below are the NAO observed values and forecasts for the rest of the month. The forecasts are agreeing that the NAO value should decrease as we head toward the end of this month but near the end of the month forecasts diverge, with some forecasting another increase and some continuing the decrease. If the NAO value did decrease, colder air would be able to push into the United States around the start of April which means despite March going out like a lamb, April may come in like a lion. This is definitely something everyone should keep an eye on as it gets closer.
Until then though, enjoy the nice weather that will be across much of the nation to end the month. With the GFS model showing few storm systems moving through, except along the northern edge of the country where the jet stream will be residing, most of the nation will experience above normal temperatures and sunny skies.

Wednesday, February 8, 2012

Spring Severe Weather Outlook

Originally posted on ZoomRadar

As winter begins to draw to a close and leaves us with all of those memories of Alaska being hit by snowstorm after snowstorm while the rest of the United States wondered when winter was going to arrive, I find myself wondering about what this spring may hold in store after such an abnormal winter. Below is an image produced using data from Rutger’s Global Snow Lab which was featured in the January 2012 State of the Climate issued by NOAA.

The image depicts the January snow cover extent anomaly in thousands of square miles based on the 1981 to 2010 average across the contiguous United States. Unfortunately the years are off by one, as the first year on the right should read 2012 as we are all aware this year was well below normal for snowfall and the previous two years were well above normal. This simple mistake aside, I wondered how might this lack of snowfall affect the forthcoming severe weather season if we were to do a simple test, science aside, and compare other recent years with below average snowfall, like 2006.

The image above shows the last seven years of tornado reports as well as the 2005 to 2011 average and this year’s reports so far. Taking a look at 2006, we see that it was the third highest year for number of tornadoes up to this date with only this year and 2008, a year with above average areal snowfall coverage, having more tornadoes reported. However, we see that 2006 ended up being the second lowest total for the number of reported tornadoes out of these years. While snow cover may not have any direct implications to severe weather likelihood, there may be an argument in how it affects the amount of moisture available and the temperature gradient needed for severe weather. The temperature gradient argument is the stronger of the two, stating that with less snowfall in the north, temperatures would be warmer, typically creating for a weaker temperature gradient and thus less severe weather outbreaks. Taking a look at this logic, we see that 2010 and 2011, years with above normal areal snow coverage, both ended up with higher numbers of tornado reports but they achieved these numbers in very different fashions, with 2010 recording most of its tornadoes much later than 2011. So maybe the below average snowfall this winter has no predictive power on the intensity of this year’s severe weather season. But there are other factors we should also consider.

The ENSO cycle has long been considered to potentially hold some power in predicting severe storms. It is common knowledge among meteorologists that a La Nina tends to slightly favor more storms in the spring, especially across the Southeast, and an El Nino tends to slightly favor more storms in the summer months. Current conditions from the Weekly ENSO Update show that we are currently in a La Nina type pattern which is expected to continue into spring. While this particular La Nina pattern is not nearly as strong as last year’s La Nina, which lasted from the summer of 2010 into the spring of 2011, could it bring typical La Nina associated severe weather patterns to the United States for this spring?

With last year’s record outbreaks occurring during a La Nina, it would be easy to jump to the conclusion that this year would result in more extreme severe weather outbreaks, especially with the pace the season has got off to. However, we must remember that this year’s La Nina conditions are not as bad as last year’s conditions and in fact, what we are currently in has not even been classified as an official La Nina. An official La Nina must have sea surface temperatures in the Pacific region used to measure the ENSO cycle at or below 0.5 degree Celsius below normal for at least 5 consecutive 3 month averages. This means the La Nina conditions would need to persist through the JFM (January, February, March) cycle which they are modeled to do but even so, as stated, it would not be at the intensity of last year’s La Nina. That being said, the ENSO cycle would lead one to believe that we could be looking at a strong severe weather season but this is far from a set in stone prediction.
Returning to temperature gradients and moisture now, the above image depicts the current sea surface temperature anomalies across the Caribbean. Of interest here is the warmer than normal temperatures in the Gulf of Mexico, the source of moisture and strong southerly wind flow during severe weather season. With warmer than usual temperatures in the Gulf, the temperature gradient would be stronger creating for stronger winds and therefore increased chances of severe weather. These warmer temperatures are due to the fact that cold air has struggled to enter the United States this year, allowing the Gulf to remain relatively warm. Temperatures in the Gulf were also above average last year though we did not see this anomaly start occurring until March and by April, sea surface temperatures were well above normal as depicted in the image below for April 28, 2011.
In fact, this time period is exactly when we started to see severe weather reports really take off last year. Investigating this further, it appears that a warmer than normal Gulf does show some correlation with increased storm reports. Monitoring of this area of sea surface temperatures should be continued into severe weather season. If the temperatures continue to remain above normal and even become increasingly above normal, we could be seeing an indicator for strong severe weather outbreaks to occur.
One last measure I will look at is the NAO which tends to be more positive during severe weather outbreaks. Once again, this generalization does not always hold true but it can be useful to look at for short term consideration of severe weather probability. As can be seen in the models below, the NAO is forecasted to remain at least weakly positive through about the end of February, meaning that the track of the jet stream will remain farther north than normal over the Atlantic region. The models do not forecast out farther than this but taking a look at the history of the NAO over most of this winter, and assuming that this trend may continue, we can expect that severe weather outbreaks would be favored in this pattern.
So what can we expect this spring in terms of severe weather?
Well, early indications would point to another active severe weather season thanks to La Nina conditions, the NAO continuing to remain positive, and warmer than normal sea surface temperatures across the Gulf of Mexico. However, it is important to note that severe weather cannot occur without the correct synoptic setup and none of what I have looked at has taken a true look at this due to its inability to be predicted accurately in the long term. Therefore, the predictions above may not pan out this spring if synoptic conditions conducive for severe weather do not form or form often enough. It will be important to remain up to date on the latest conditions of the variables mentioned in this article as well as the synoptic scale conditions across the United States as we continue to inch our way into this year’s severe weather season.

Monday, January 30, 2012

Gone without a trace? Where is winter?

Originally posted on ZoomRadar

First off, let me introduce myself. My name is Tory Farney and this is my first blog post here on ZoomRadar. I graduated from Cornell University in 2011 with a Bachelor of Science in Atmospheric Sciences. Currently, I am attending graduate school at Mississippi State University where I plan to receive my Master’s while studying Professional Meteorology. I am most interested in severe weather, particularly severe thunderstorms, tornadoes, and snowstorms, specifically lake effect snow which I grew up experiencing. Additionally, I am interested in forecasting major weather events as well as looking at some applied climate change topics. Therefore, most of my blog posts will track along these topics. And now on to today’s topic: where is winter?

By now everyone seems to have caught on to the reality that this winter has been anything but winter in the contiguous United States. As of January 30th, only 27.3% of the contiguous United States was covered in snow.


Compare this to last year’s 39.6% and it is easy to see that winter has been easy thus far. This may leave many wondering, where is winter and now that it is nearly February, is it already over? For these answers, we can turn to the North Atlantic Oscillation (NAO), which has remained fairly positive this winter.


When the NAO is positive, it means that the jet stream is farther north than usual over the northern Atlantic area. The direct effect of the jet stream being farther north than usual allows for warmer temperatures to occur across the contiguous United States thus limiting the potential for the air to be cold enough for snow on any given day. As the charts above show, the NAO has been positive most of winter with only a couple very brief exceptions and the forecasts show that this pattern is likely to continue into February.


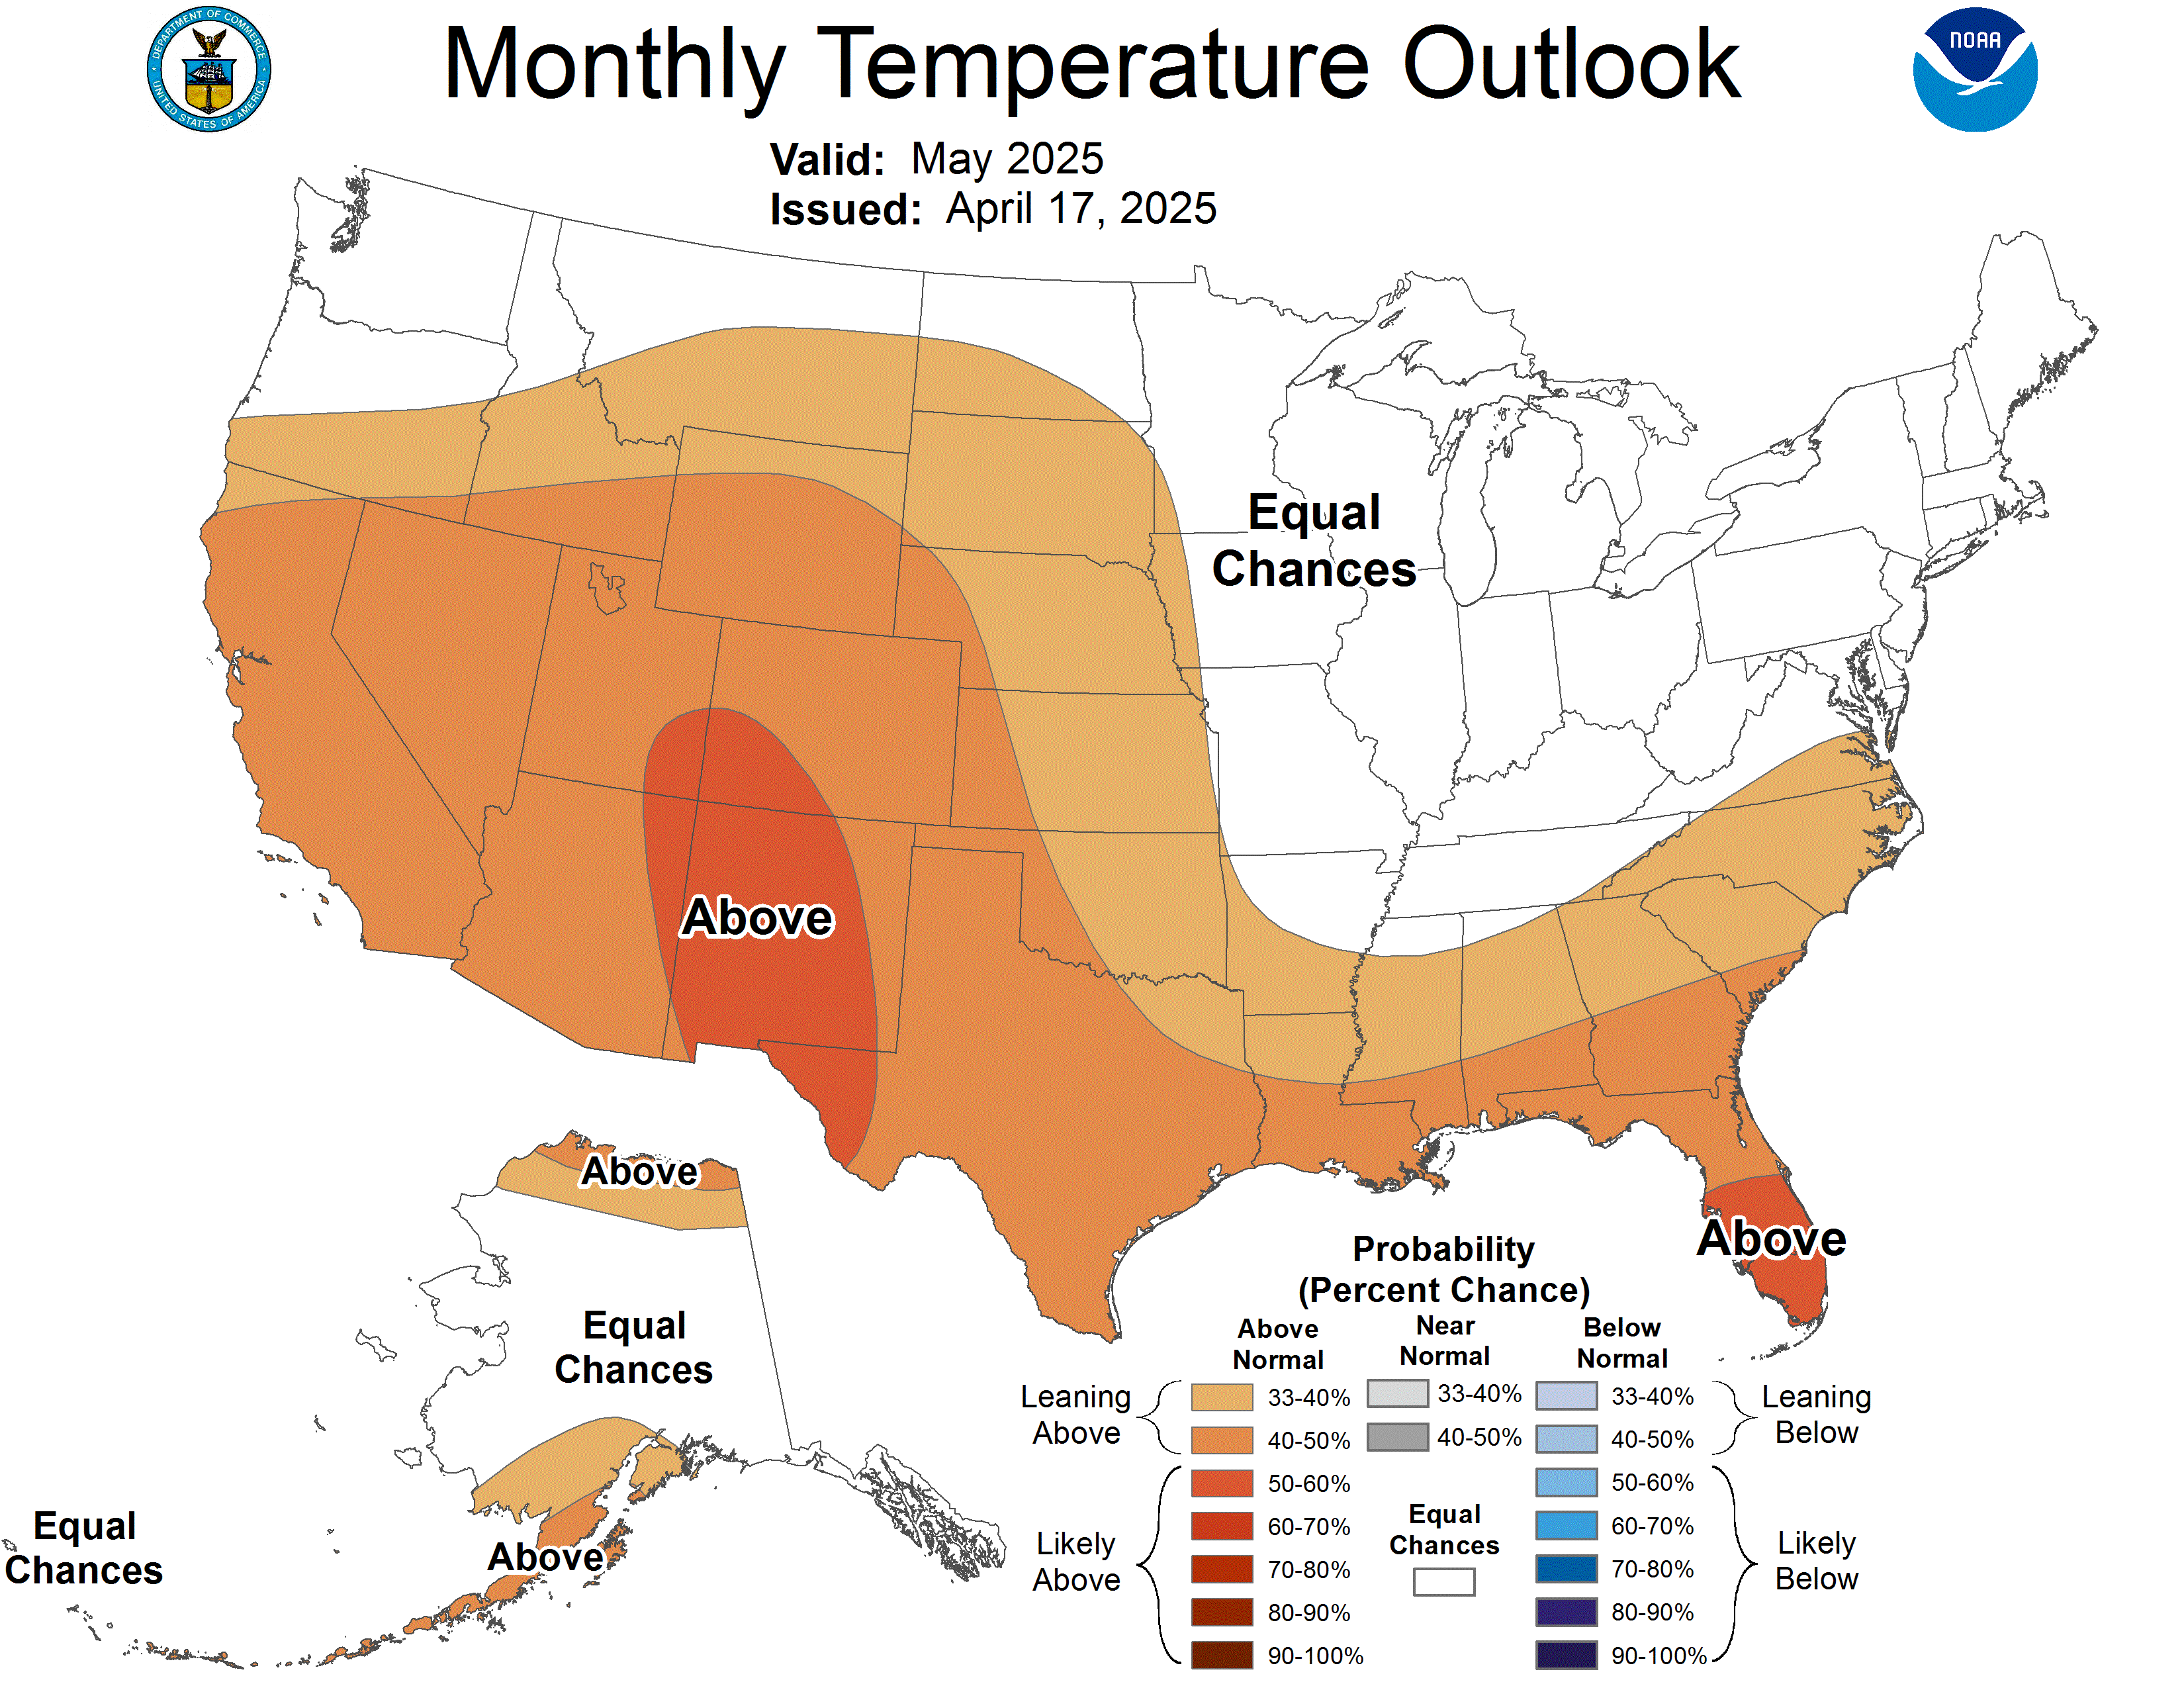
When looking at the current 30 day temperature outlook for the United States, we see these above average temperatures continue to be forecasted, especially across the eastern two-thirds of the country. That being said, it is unlikely that the snowfall debts that have been accumulating this season will be erased. This winter will go into the books as the year without much of a winter for most areas across the contiguous United States.


In the image above, the yellows to the reds depict areas with below average seasonal snowfall through January 30th with the reds being extremely below average. However as the image shows, not all of the United States has been spared this season, some areas depicted in the blues above, have actually received above average snowfall so far this season. Additionally, many areas in Alaska, where winter has been bottled up this year due to that positive NAO, have received near record and record amounts of snow.

So to answer the question of whether winter is over, historically speaking we are just through the hardest days of winter and beginning the upward climb to spring and when considering the NAO forecast, it is likely that winter will continue to spare most of the contiguous United States. But why leave it up to meteorologists to decide, check out what Punxsutawney Phil has to say on Groundhog’s Day and see whether or not we should expect six more weeks of winter or not. Early predictions indicate that Phil will not see his shadow signifying an early start to spring and thus agreeing with what meteorologists are expecting.