Friday, February 8, 2013

2013 Chasing Days

Want to know when your best chance to go storm chasing will be?  In a new segment on my blog, I will post periodic updates informing you of when your best chance of tracking down that big storm could be.

Based on the latest model guidance, these are the days I consider their to be a chance of severe weather in the short to medium range.

February 9th

The latest Day 2 Outlook from the SPC shows a slight risk of storms across portions of northern Texas and southwest Oklahoma.  The main threats here will be wind along with the potential for a tornado or two and some small hail.  These storms will occur along and just in front of a sharp cold front pushing east through the region.  Limited moisture and instability will keep this threat relatively low.

February 10th

The latest Day 3 Outlook from the SPC depicts a slight risk of severe thunderstorms across eastern Texas, most of Louisiana, and western Mississippi.  These storms will be associated with the same warm sector and advancing cold front as the previous day's storms.  Once again, limited moisture and instability will preclude a more significant threat.  Nevertheless, damaging winds will be the main threat along with some potential for marginally severe hail and a couple tornadoes.

February 11th and 12th

Thunderstorms may continue in some limited instability and moisture along areas of the Gulf Coast and across southern Georgia and northern Florida.  Once again this should be a limited threat with only a few damaging wind reports or hail reports.  Shear values support a weak tornado or two.


February 13th

Thunderstorms will exist across portions of central Florida during this period.  Moisture will be fairly good but instability will be limited still.  The main threats should be damaging winds and some marginally severe hail though a tornado or two cannot be ruled out, especially in the northern sections of the threat area.


In this section, I will give some estimates on severe weather dates in the long term.  These dates are not based solely off of model guidance but rather based on information from teleconnections and other knowledge.  It is important to remember that these dates are far from set in stone and the farther away they are, the more likely they are to change.  But I figured hey, let's have some fun and see how close I can come on some of these springtime events.  Below is what I am thinking for events through about Mid-April.

February 19th - Southern Texas
February 20th - Gulf Coast
February 21st - Florida
February 24th - Southern Plains
February 25th - Mississippi Valley
March 6th - Mississippi Valley
March 7th - Deep South
March 21st - South/Central Plains
March 22nd - Deep South
March 23rd - Southeast
March 25th - Mississippi Valley
March 26th - Southeast
March 30th - Southern Plains
April 2nd - Southeast/Midwest
April 4th - South Plains/Mississippi Valley
April 5th - Southeast
April 10th - South Plains/Mississippi Valley
April 11th - Southeast

Be on the lookout for my next update in a few days!

Thursday, February 7, 2013

Update: February 7-9 Northeast Winter Storm

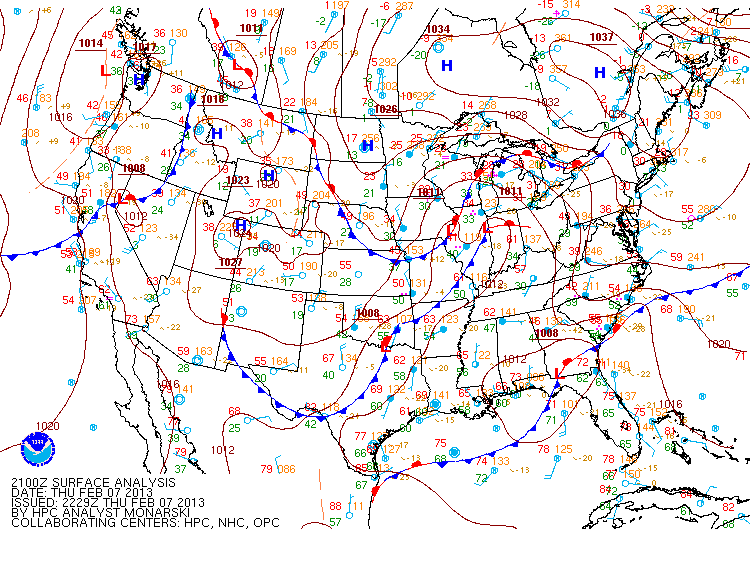
Surface chart as of late this afternoon
A major winter storm is set to begin tonight and continue through Saturday night in some areas of the Northeast.  A low pressure system, currently located around northern Illinois, will move east tonight into northern Ohio by morning.  Meanwhile, another low pressure system, currently located along the Georgia and Florida border, will push up the east coast tonight reaching the North Carolina coast by morning.  By Friday evening, the coastal low will be located off the coast of New Jersey and Delaware, where it will merge with the energy from the Midwest low pressure.  As this happens, the coastal low will deepen dramatically reaching sub 980 mb readings according to the 18Z runs of the NAM and GFS.  The peak strength of this low will be overnight Friday off the coast of New England.  This will be when the heaviest snow falls and when the gustiest winds occur then.  By Saturday morning, the low will start to weaken and move slowly to the east throughout the day.  Only a few lingering snow showers will likely remain across portions of New England, especially near the coast, by the time Saturday night comes around.

So when can you expect the precipitation to begin in your area?

To the right is a map I made depicting the onset of the precipitation from either of the lows.  The earliest onset of precipitation is occurring right now across areas near Lake Ontario as snow slowly begins to cover this area.  By tomorrow morning, snow will be covering many areas across Upstate New York, Vermont, and the western portion of New Hampshire, Massachusetts, and Connecticut.  Most of this will be in the form of snow associated with the low originating from the Midwest.  Precipitation will also be occurring across Ohio from this low.  Meanwhile, the coastal low will be responsible for rain, snow, and sleet starting by tomorrow morning across eastern Pennsylvania, New Jersey, and the lower portion of New York and Connecticut.  By midday precipitation will encompass most of the Northeast.  Northern Maine will be the last are to see the onset of snow, occurring either tomorrow afternoon or tomorrow night.  It should be noted that this denotes only when the precipitation will begin for an area and not when the heaviest snow will be.

So when will the heaviest snow fall in your area?

To the right is a map I made showing when the heaviest snow will likely fall in each area.  Keep in mind that this is the heaviest snow with respect to each area.  This means that some areas will receive heavier snow than others but this map does not take that into account.  In general, the areas receiving the heaviest snowfall will begin in the west and move toward the north and east as the time period progresses.


So how much snow can you expect?

Snowfall totals are still in question for some areas as the exact track of the lows, especially the coastal low, could result in drastic changes in snowfall.  For instance, in the 18Z run of the NAM and GFS models, the NAM runs the coastal low a little closer to the coast.  This means the difference between 18" plus of snowfall for New York City with the NAM track and 5" to 10" for the GFS track.  With that in mind, to the right is my prediction for snowfall totals starting this evening through Saturday night from this system.  This will be the first major winter storm for many of these areas in nearly two years.  The heaviest snowfall
totals appear as though they will span from near New York City northeastward into southern Maine.  One thing to consider is that especially along the coast, strong winds will also accompany this snowfall resulting in blowing and drifting snow.  To the right is what I expect for wind gusts during the event.  For most areas wind gusts will only cause minor drifting and blowing.  However for coastal Maine, southeast New Hampshire, eastern Massachusetts, Rhode Island, Connecticut, and Long Island, winds could cause major drifting of any accumulated snow and result in some isolated power outages from falling limbs and perhaps a few trees.  People in these areas should be prepared for the worst case scenario that they could be without power during the winter.  Temperatures Saturday night after the storm will be quite cold too with most areas getting down to 20 or lower.  Some areas will even see temperatures at or below zero.

Bottom line, if you do not need to travel during this storm, don't!  Stay safe everyone.

Wednesday, February 6, 2013

February 7-9 Northeast Winter Storm

A winter storm will impact portions of the Northeast beginning Friday and continuing through Saturday Night.  While confidence is high that this winter storm will form, differences in model tracks and timing have left some questions.  Below are the 12Z and 18Z GFS and NAM model runs depicting snowfall through Saturday evening.


The main difference here is the GFS starts the formation of the low pressure off the coast of the Carolinas about 6 hours sooner than the NAM model does.  This time difference results in the precipitation shield reaching the Northeast sooner and more of the precipitation falling overnight.  The nighttime temperatures will be more conducive for snow or sleet to occur at the surface and thus accumulations could occur.

The other difference is in the track and strength of the low pressure.  The 18Z GFS model is depicted to the right and the 18Z NAM model is depicted below that.  The NAM model takes longer to mature the low and keeps it farther off the coast than the GFS model.  The result is a more impressive look to the GFS but the NAM is still able to achieve similar snowfall amounts in most areas due to its higher QPF (Quantitative Precipitation Forecast) totals.  This is likely due to its better understanding of processes related to the deformation zone as well as stronger PVA (Positive Vorticity Advection).
Another major difference has to do with the phasing of the energy between the shortwave cutting through Michigan and Upstate New York and the Coastal Low.  The NAM model appears to hold off on phasing these energies until after the Coastal Low is north of New York City.  Meanwhile, the GFS phases the energies much sooner, in the vicinity of New York City, about at the point when the low begins to push more east, rather than north.  This earlier phasing helps to strengthen the low and produce heavier precipitation amounts across the New York City area instead of out to sea and along coastal Maine as the NAM does.

Keeping in mind these model differences, a major snowstorm will impact portions of the Northeast beginning Thursday night.  Given what the current American models are thinking, I would lean closer to the GFS solution as it seems to have a slightly better handle on how the energy will evolve.  Additionally, it has been the more accurate model thus far for this event, predicting better what would happen today over Texas with a portion of the energy that will help create this Coastal Low.  The Arctic Oscillation is also forecast to be slightly negative, which could be further evidence for favoring the GFS solution.  Another way to verify this thinking is to consult the ECMWF model.
The ECMWF model has a track of the low that is very similar to the GFS model.  One reason for the similarities in these models is they are both global models, which means they are able to take into account information from the whole globe and produce an output for the globe.  The NAM model on the other hand only takes into account information from around North America and therefore only has an output in that same area.  One major similarity between the ECMWF and GFS then is that they both forecast a strong area of high pressure (ridging) that results in the stalling of the Coastal Low off the coast of New England (as shown in the image with the black line showing the blocking ridge).  This results in a longer period of precipitation as the low slowly moves and may have been why the GFS phased the energies better as previously mentioned.  The NAM model does not depict as strong of a high pressure due to its limited domain.  Therefore, it continues the Coastal Low on a northern track instead of stalling it.  Now it is likely that as the event draws nearer that the NAM model will understand the effects of the high pressure more, but for now this is a major influencer of the Coastal Low track that the NAM is missing.  The GFS and ECMWF both forecast the ridge to begin breaking down over the Atlantic Ocean late Saturday night.  This would allow the Coastal Low to begin moving out to sea as opposed to northward as the NAM model has depicted.  This will result in major snowfall forecast differences in the northern portions of Maine, New Hampishere, and Vermont.
So what am I thinking in the way of snowfall amounts then?
Well, given the overall better solution of the track via the GFS and ECMWF but better feedback via the deformation zone by the NAM and ECMWF, I will go with a blend of the best qualities of all of these models.  Below is my snowfall totals for the event across the Northeast.  This is subject to change but as of right now this is my best estimate.

The snow will be combined with strong, gusty winds in many areas, especially along the coast too.  This will result in blowing and drifting snow, making travel almost impossible at times Friday and Saturday.  Stay tuned to this evolving situation.

Monday, January 28, 2013

Severe Weather Update!

My initial thoughts on the severe weather outbreak that will begin tomorrow have changed only slightly since last night when I first posted them.  For those who may not have seen my post from last night, here is the link to it.  At the time the Storm Prediction Center (SPC) was about to issue its first Day 2 Outlook for this event, which can be seen below.

image

This outlook looked very similar to the previously issued Day 3 Outlook but had some major differences when compared to the map I posted just a hour before they issued their outlook, which can be seen below.

image

While I did not disagree with the location of the 30% risk issued by the SPC, I questioned their reasoning for not continuing this risk into the night, downstream of their current region.  It appeared the only reason may be a concern about decreasing instability overnight but as I viewed the models again, I was confident this should not be a limiting factor.  In fact, as I will show further in this post, the best instability will actually be during the early overnight hours.

Late this morning during the next issuance of the Day 2 Outlook, the SPC issued an outlook which was much more in line with my previous thoughts from the night before, as can be seen below.  In fact, a moderate risk was even issued for some areas (seen here as the 45% hatched region).  This new outlook actually raised some areas in Mississippi from a 5% risk of severe weather within 25 miles of a point to a 45% chance of severe weather within 25 miles of a point with at least a 10% chance of significant severe weather, a very drastic change!

image

This will be the first significant severe weather outbreak of the year, with tens to hundreds of damaging wind reports expected and perhaps a few tornadoes as well.  Just how significant might this event be?

Well, over the past 15 years, only five Day 2 moderate risks have been issued in January by the SPC.  What happened those other four times?

January 22, 1999: 43 tornadoes, including 2 F3 tornadoes, injured 20 people and killed one across Alabama, Arkansas, Illinois, Kentucky, Louisiana, Mississippi, Tennessee, and Texas resulting in about $76 million in damages.

January 3, 2000: 11 tornadoes, including 3 F3 tornadoes, and 101 wind damage reports resulted in 21 injuries across Arkansas, Indiana, Kentucky, and Mississippi resulting in about $72 million in damages.

January 2, 2006: 18 tornadoes, including 1 EF3 tornado, and 73 wind damage reports as well as 107 reports of 3/4” hail or greater resulted in 5 injuries across Georgia, Florida, Illinois, Kentucky, and Missouri resulting in $7 million in damages.

January 13, 2006: 19 tornadoes and 45 wind damage reports injured 34 people and killed one across Alabama, Florida, Georgia, Louisiana, North Carolina, South Carolina, and Virginia resulting in $7 million in damages.

Needless to say, a multi-million dollar day in damages could be ahead of us based on these prior events.  So let’s take a look at the details using the 00Z NAM model run.  I expect that thunderstorms will be ongoing at the start of the day in the Oklahoma area and will quickly expand in coverage throughout the morning across the western portions of the threat region.  It appears initial convection will begin to form into a squall line rather quickly, though a few discrete cells out in front of the line in Arkansas, Missouri, or Illinois may not be out of the question.  By afternoon instability will be on the increase as evidenced by the image below showing CAPE values during the evening.  This will allow the squall line to intensify as it becomes more organized across Texas, Arkansas, Oklahoma, Missouri, and Illinois, as shown by the simulated reflectivity image below for the same time as the CAPE image.

image

image

As night falls, expect CAPE values to remain steady or rise slightly in front of the squall line as the trough becomes more negatively tilted.  This will allow colder air to flow in aloft resulting in steeper lapse rates and these better CAPE values.  Additionally the low-level jet will really strengthen after nightfall, aiding in shear values which could improve the chances for tornadoes as well as the chances for wind damage.  This low-level jet is shown for around the midnight hour and it can be seen that many areas will have wind speeds of 50 knots or greater just  a few thousand feet above the surface.

image

This could strengthen effects of the squall line even further as shown by the simulated radar image below for around midnight.  One other serious thing to note on this radar image is something the NAM model has been advertising more and more today and it will be interesting to see what the RAP and HRRR models have to say about this soon when they begin to predict out this far.  That thing is, discrete cells in front of the squall line.  According to the latest run of the NAM, these cells may start up in southern Mississippi and southern Alabama a couple hours after dark and rapidly speed toward the north northeast at 40 to 60 mph.  Current indications are that these discrete cells could affect portions of Mississippi, Alabama, and Tennessee before being overtaken by the fast-moving squall line in the early morning hours.

image

If these cells do indeed form, they will have incredible speed shear to work with and some directional shear.  This shear has resulted in large helicity values across the aforementioned region and EHI values could also be fairly good for this time of year.  The EHI values for around midnight are shown below.  It is important to note that while the RAP model does not show out this far in the future yet, comparing times that it does go out to with the NAM solution has indicated that the RAP believes that EHI values could be stronger than the NAM depicts.  Stronger EHI values could show a greater chance of tornadoes during the overnight hours.

image

Another thing that could aid in the evolution of supercells during the night is what the NAM model indicated could occur during the afternoon hours across portions of Mississippi and Alabama.  This thing is a clearing in the clouds.  If the clouds do clear for a bit or even thin during the afternoon hours, daytime temperatures could raise quickly resulting in higher values of CAPE and a much more unstable atmosphere.

image

After the early morning hours, discrete cells should begin to die off and merge with the squall line as instability wanes.  The squall line should also weaken some as we head into sunrise.  Given all of this information I have produced a couple more maps below indicating my threat regions for wind damage and potential for tornadoes.

image

image


Tomorrow and tomorrow night will certainly bring about many wind damage reports.  Tornadoes will certainly be a possibility, especially if those discrete cells form overnight.  Nevertheless, any sunshine that can peak through tomorrow will enhance the severe weather threat but even without the sun, a potent trough coupled with strong atmospheric winds at all levels will be enough to spark severe thunderstorms.  Keep alert and know where you can get your severe weather information tomorrow and especially tomorrow night.  Try to find a way to get notifications even when you are asleep as these will be the best hours for tornado potential.  Stay safe everyone!

Thoughts on the January 29/30 Severe Weather Outbreak

A strong cold front will push its way across the nation over the next few days, sparking severe weather for many areas.  The Storm Prediction Center has issued areas of concern for both Tuesday, January 29th as well as Wednesday, January 30th, which are presented below.  Based on what I have been looking at, I will give my best insight into where I believe the threat will be during the hours of January 29th into the morning of the 30th.


The 00Z NAM model is in fairly good agreement now with the past few runs of this model and the 00Z GFS model has begun to come around to a more similar solution to what the NAM has been advertising over the past day.  Therefore, I will only show the 00Z NAM model figures below, keeping in mind that the 00Z GFS model is similar but running a few hours faster than the 00Z NAM model.

The first image below is dewpoints from 06Z Wednesday, as this is when they will be maxed out for most areas that have not had the front pass them yet.  Dewpoints in the mid to upper 60s will exist across most of Louisiana and Mississippi during this time frame with 60 degree dewpoints extending as far north as Illinois.  It is also important to note the strong southerly flow in the warm sector.


CAPE values will be limited across the severe weather region but a large swath of 500 J/kg or more should exist throughout the day and overnight along the lead edge of the front.  While this is not a large amount of CAPE by any means, there will be enough forcing from other means to trigger storms.  The biggest factor that the limited CAPE could play into is limiting the threat for supercells in front of the main squall line.  However, as can be seen in the image below, which is once again for 06Z Wednesday, CAPE values may surpass 750 J/kg and near 1000 J/kg during the overnight hours, which is not bad considering that it is night and that values struggled to reach this during the day.


Couple these CAPE values with an intense low level jet, which will strengthen overnight, and the threat for tornadoes will certainly exist across portions of Arkansas, Louisiana, Mississippi, and Tennessee.  The tornado threat should also be greater at night as the trough begins to rotate from a positive tilt into a more neutral to negative tilt by morning, helping to aid in more cold air aloft, which is likely helping to raise the CAPE values too.

In my forecast I have taken into account where dewpoints of at least 55 will exist, taking into account where precipitation will be occurring during the time frame as well.  This I have outlined in the green color.  Next in orange I outlined an area which should see CAPE values in excess of 500 J/kg.  Next I looked at where low-level winds will be strongest by viewing surface winds up to 850 mb and I outlined this area in purple.  I viewed EHI values as well as helicity values to determine where these values were the best and outlined that area in red.


This information, coupled with my general meteorology knowledge and having started following this system since it was over 300 hours away, I have come up with the following map depicting the areas most at risk for damaging thunderstorms during what the SPC will consider the Day 2 time period when they issue their new outlook in less than one hour.  The yellow area represents an area where I would expect to see isolated to scattered wind damage and the red area represents an area where I would expect to see more scattered to widespread wind damage reports.  The red area receives this heightened threat due to the fact that lower level winds will be stronger at night and this is when the storms will impact this area.  Additionally, this area is also at risk for a few tornadoes as I outlined my best tornado threat area in pink.


Overall I would expect this to be mainly a damaging wind event given how strong the low-level winds are and that the main storm type should be linear.  However, even with the limited CAPE values, especially in the nighttime hours I would not rule out a few tornadoes.  The threat of tornadoes could be higher if supercells can form out in front of the main line of storms but this will likely not be known for sure until the event draws closer.  Definitely stay tuned to wherever you get your weather information and be on the lookout for another blog from me tomorrow night to update my forecast.

Tuesday, January 22, 2013

A New Meaning to Nuclear Winter!

With a sharp shot of cold air having pushed its way into the United States, many in the eastern half of the nation are currently experiencing the coldest air of the season.  Below is the 00Z NAM model sounding for Pittsburgh at 10PM this evening.


The modeled surface temperature at this hour was around -14 degrees Celsius.  This means that the snow growth region actually occurs right at and just above the surface.  Knowing this information, what could possibly be showing up on the Pittsburgh radar?


This precipitation is located just north of Pittsburgh and was remaining fairly stationary over time.  Give up?  Let me give you a little more information.  As you may have noticed in the model sounding from above, the forecasted wind direction near the surface was from the west northwest.  Notice how this band of precipitation is also located in this orientation.  Now I know many of you may be thinking, oh well it must be some kind of lake effect then.  Well it kind of is, but what is the source of the water?  Need help?


The red dot located just to the west northwest of the band is the Beaver Valley Nuclear Generating Station.  It is so cold that the steam being output from the nuclear power plant is forming into dendritic ice crystals and falling as snow across the northern suburbs of Pittsburgh!  In fact, the National Weather Service in Pittsburgh has actually received reports of accumulating snowfall up to one inch from this band of snow.  Try forecasting that one!

Wednesday, January 16, 2013

Snow Potential for Starkville!

With little to no winter weather precipitation last year, parts of the Deep South received an icy blast from old man winter over the past few days.  Ice accumulations from freezing rain piled up across parts of Louisiana, Arkansas, Tennessee, Mississippi, and Alabama while other areas of these states received flooding rainfall.  Now snow could become an issue for some areas tonight and tomorrow morning.  Below are my thoughts on how this event could evolve tonight and tomorrow for Starkville, MS.  Current radar imagery reveals lingering showers over the Golden Triangle Region with temperatures hanging out mainly in the mid 30s.


Rain showers will continue overnight but as a cold upper-level low continues to move closer to the area, the above surface air will begin to cool off.  This will result in the elevated melting layer disappearing throughout the overnight as evidenced by the 18Z NAM run for 3am local time below.  During the couple hours leading up to this time period, the elevated melting layer would be shallow and cold enough to support sleet but other issues will likely prevent this.  The issue is that the best snow growth region does not occur until around 17,000 feet at 3am.  Snow could form at lower levels possibly down near 12,000 feet but even at that height, the cloud height is not reaching these levels.  Therefore it is my concern that while the atmosphere could support snow, dendritic crystal growth will not start to occur and thus precipitation will fall as either rain or freezing rain depending on the surface temperature.


Just a couple hours later though, the 18Z NAM does show the cloud heights growing to a point where dendritic crystal growth could occur, though not optimally.  At this stage an hour or two before sunrise, I would expect very wet snow to begin falling with low snowfall ratios as most of the layer is near freezing, nearly maximizing riming potential.


As the sunrise nears, the clouds will finally reach an area for optimal dendritic crystal growth and as the layer continues to cool, snowfall ratios will increase.  Snow will likely continue to fall all morning before mixing with rain around noon and ending as rain showers in the early afternoon.  The 18Z GFS also supports a solution similar to this.

This specific event does have a few things going for it.  One, the NAM specifically has really struggled with understanding just how cold this air mass is.  Today’s high should have been in the low 40s according to the NAM in the Starkville area but the actual high was only 37 at KGTR.  Additionally, upper air temperatures upstream have been confirming a couple degrees cooler than the model soundings have been showing.  These two model errors could mean cooler temperatures at the surface and above the surface overnight resulting in a higher chance of freezing rain and some potential at a quicker turnover to snow.

Taking a look at precipitation amounts now, strong PVA should effect the region tomorrow morning, enhancing uplift.  Diffluent flow aloft will also help uplift during the early morning and mid-morning hours however, the left rear quadrant of the jet may hinder some of this uplift later in the morning.  Additionally, warm air advection from the north may help with uplift.  The below image from the 18Z NAM depicts this uplift occurring around sunrise tomorrow.


So what am I expecting for snow totals?  The 18Z GFS would support a couple inches whereas the 18Z NAM supports anywhere from 2 to 4 inches.  I expect these snowfall totals will be about correct given the upper air support but given that this is the first snow of the year for this area, the wet ground conditions, and near freezing surface temperatures, I expect ground accumulations to be limited.  Snow will stick first to colder surfaces such as grass and trees where up to an inch may be possible but on roadways I would expect all snow to melt except on bridges where some slush could develop.


If some heavier snow can develop, as sometimes occurs with these kinds of systems in the Deep South, it would not be out of the question that minor accumulations could occur on area roadways but at this time I would not expect this to occur.  Nevertheless, be sure to allow extra time to travel tomorrow and to follow winter weather driving tips such as limiting the use of your brakes and allowing extra distance between you and the vehicle in front of you.